
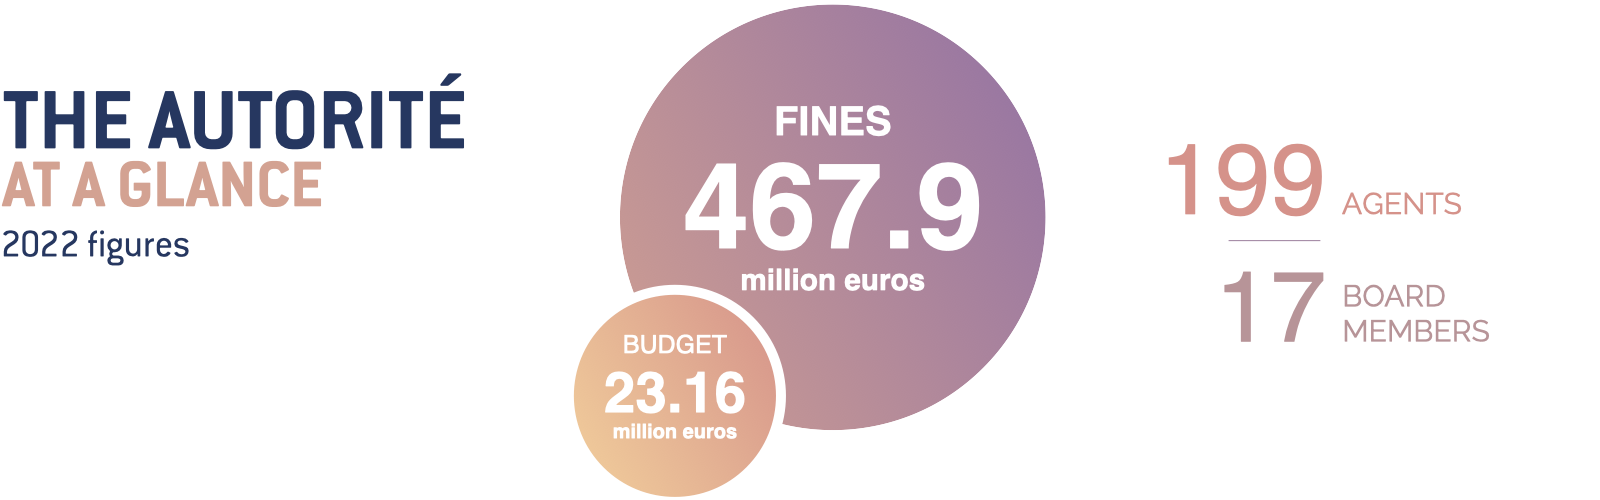
Key figures
How many employees do we have? What is our budget? What impact does our action have on the economy? What is the total amount of the fines handed out? How many mergers and acquisitions are reviewed each year? Do we often apply EU law?
Find out more about the Autorité through a selection of figures and indicators.
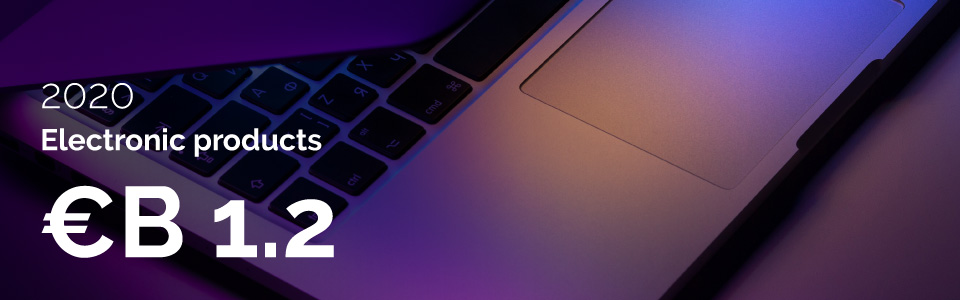
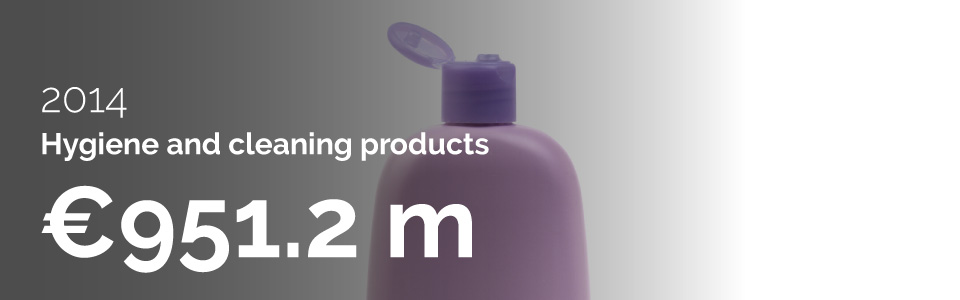
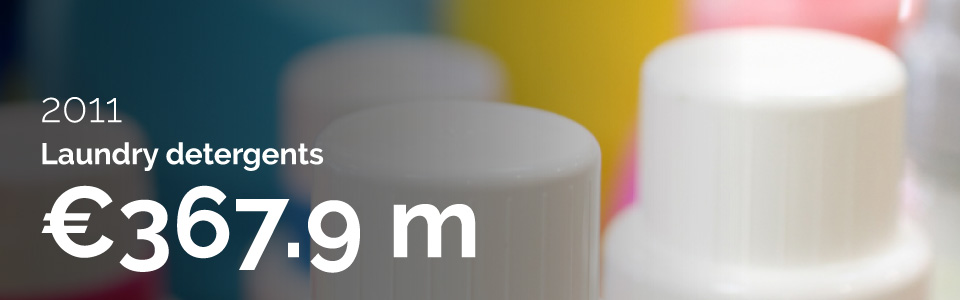
Top fines handed out since 2011


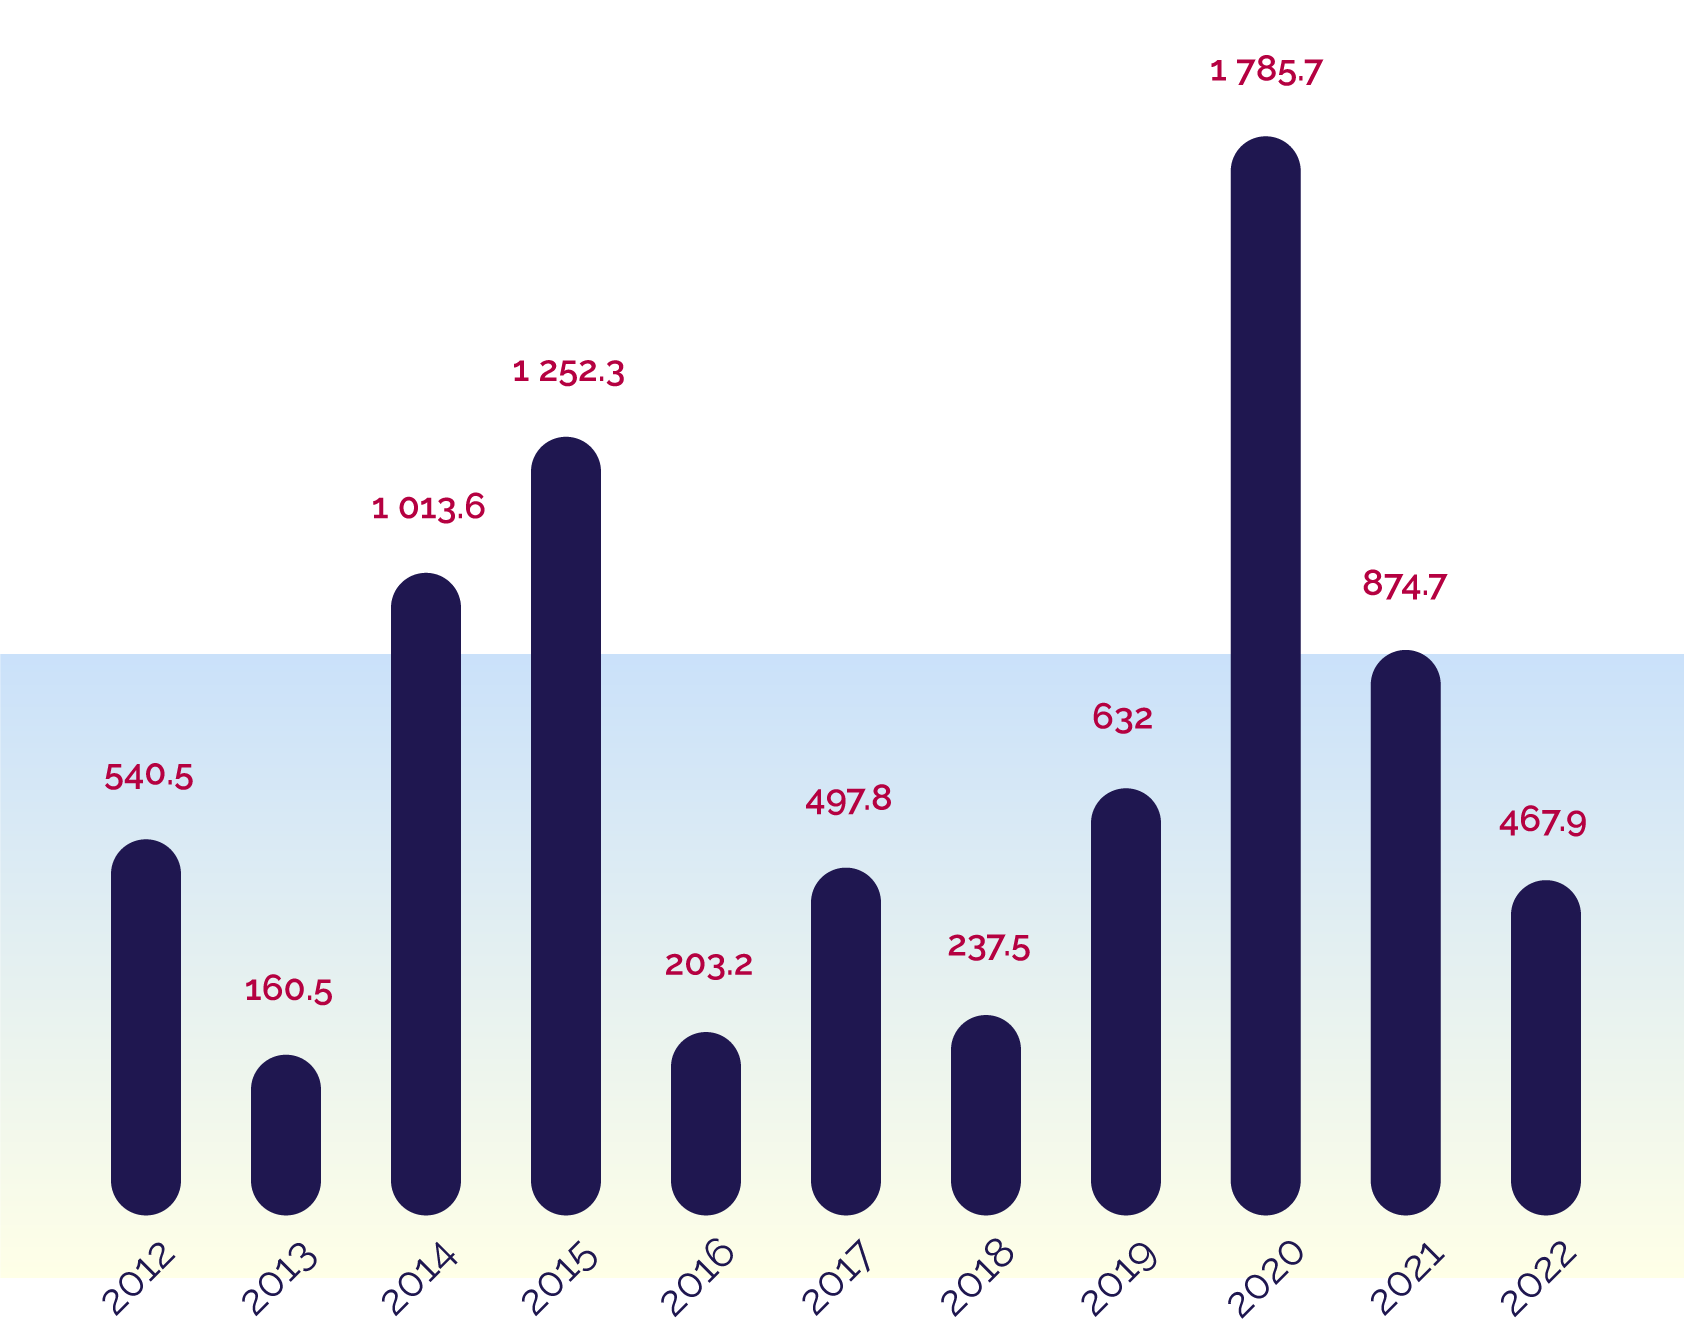
Amount of fines since 2012
While the Autorité’s penalties policy is designed to have a deterrent effect, the Autorité nevertheless ensures that penalties remain proportionate to the size of the affected market and the ability of the companies or bodies concerned to pay.
The graph below presents the evolution of the amount of fines. Amounts are shown in million euros.
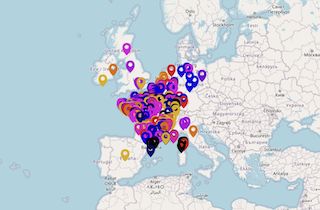
Interactive mapping of the companies fined by the Autorité
Implemented by the Digital Economy Unit, this map aims at presenting in an innovative and interactive way the work carried out by the Autorité. It builds on the resources available via Etalab regarding French companies.
The tool was crafted thanks to open and free solutions. Further, data is made available on Data.gouv.fr so that it can be reuse in the framework of new projects.
Interactive network graph tool
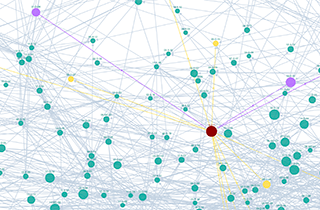
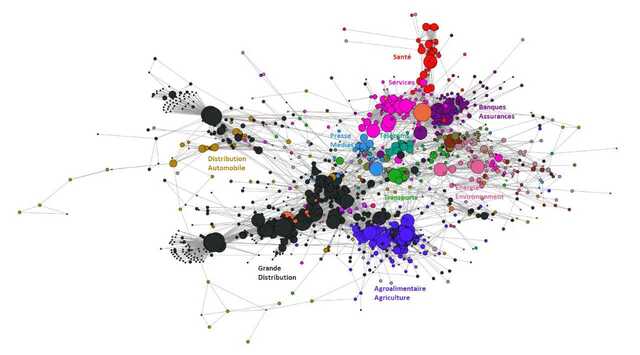
Interactive network graph tool for merger decisions
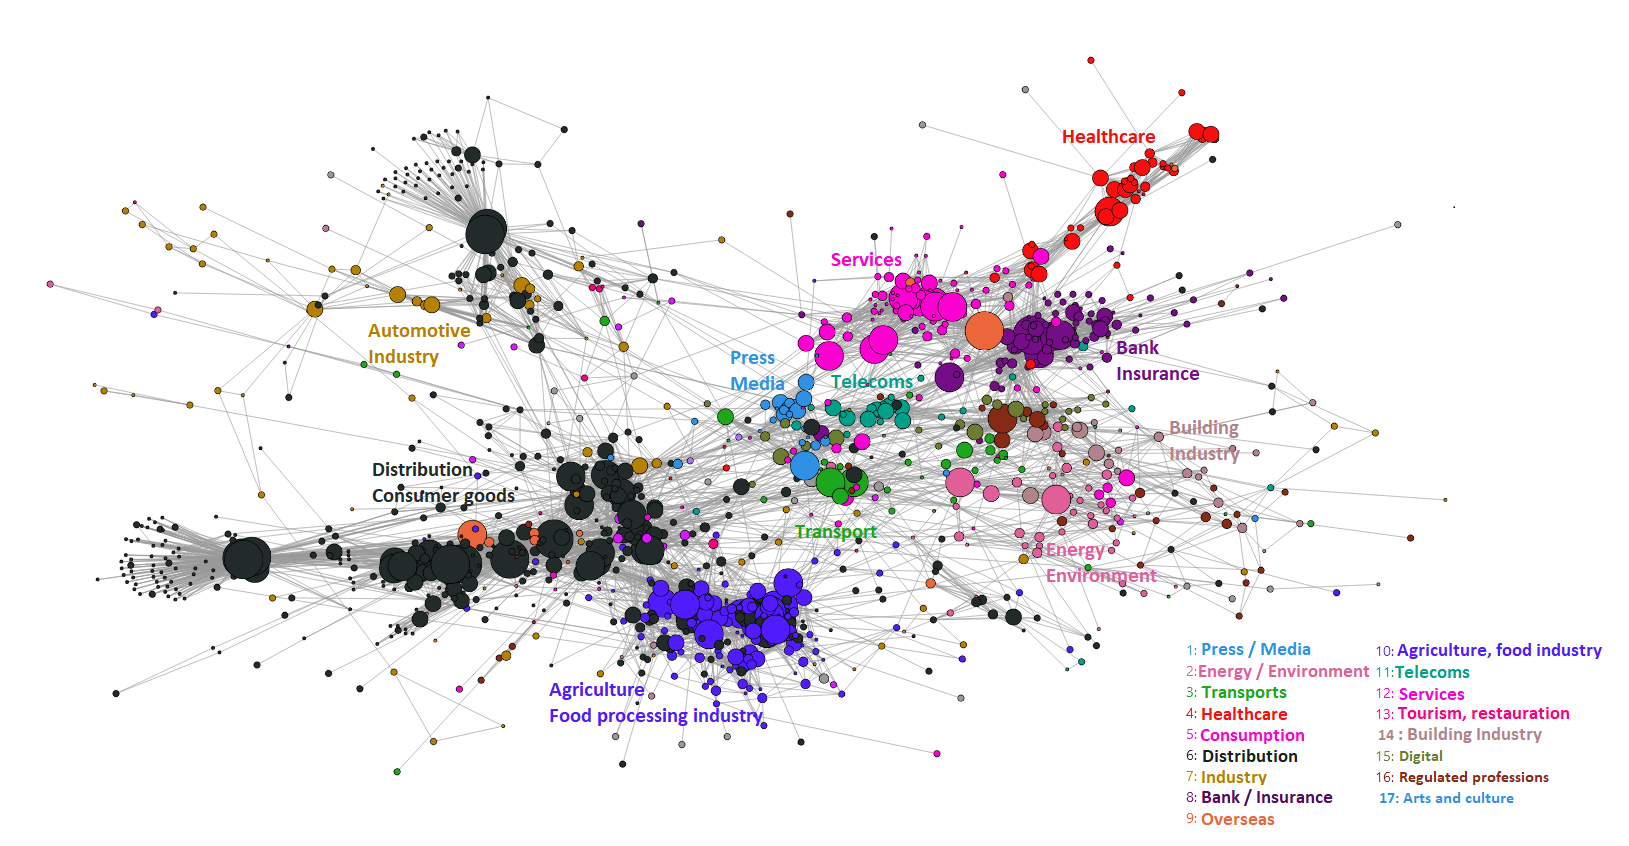
The tool has been replicated for the 3275 merger decisions published by the French Competition Authority up to 1st January 2024. Its code is now available on the Autorité's Github.
A high-resolution image of the corresponding graph is also available here until the interactive tool is made available online.
Impact on the economy
In order to assess the impact of its action on the economy, the Autorité decided to include an overall evaluation in its annual report in 2018.
Based on methods recommended by the OECD, this evaluation takes into account not only the amount of fines imposed on companies but also the gains to the economy resulting from the cessation of anticompetitive behaviour and the implementation of remedies in the context of mergers (2018 Annual Report published on La Documentation Française/page 29).
Review of mergers and acquisitions
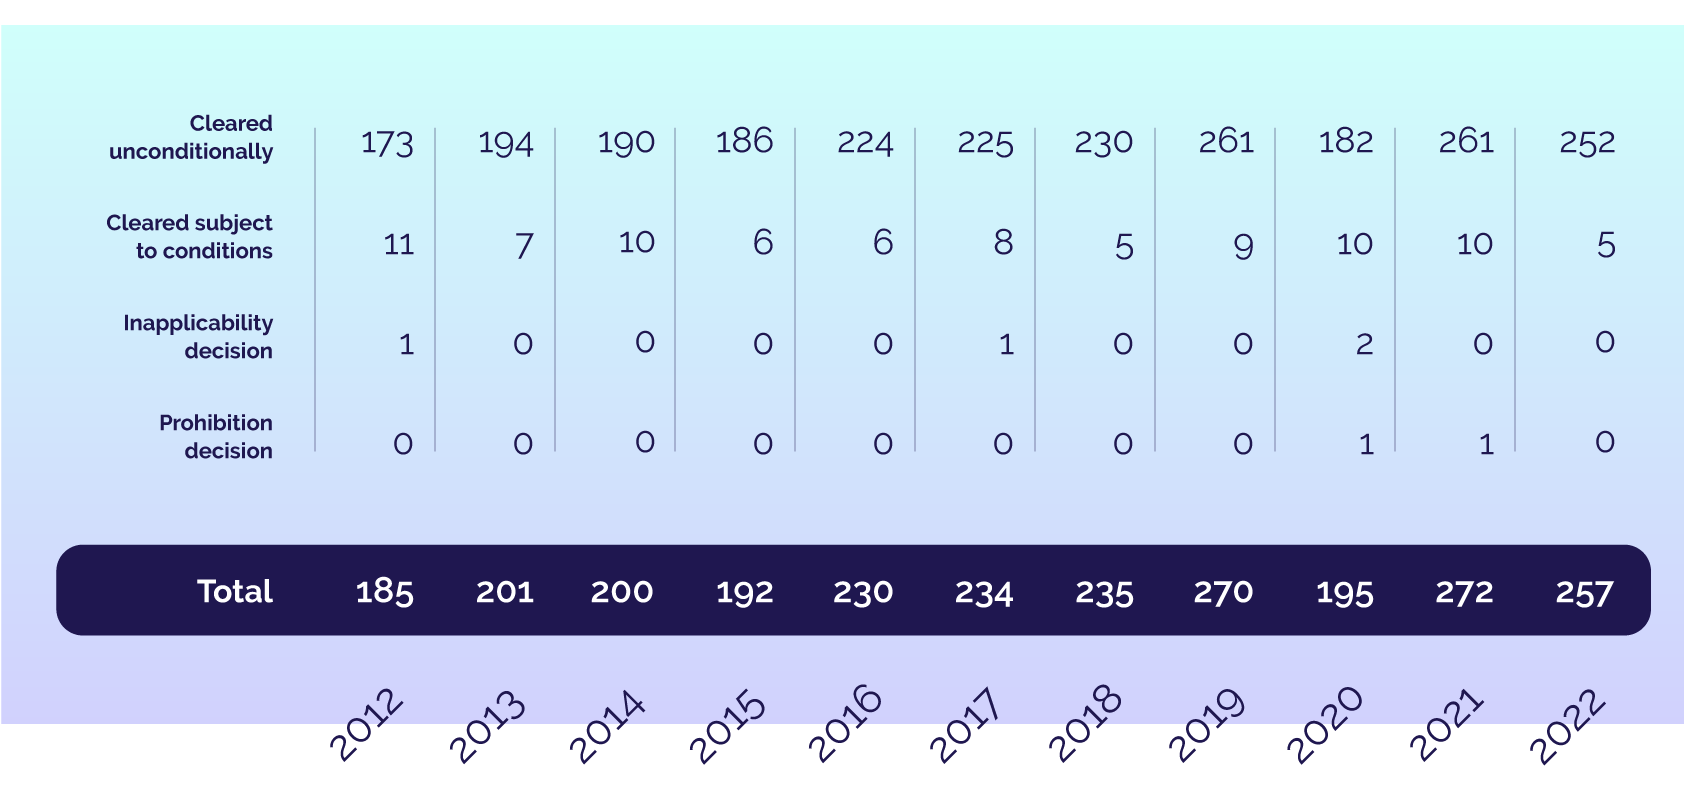
Since 2012, the Autorité de la concurrence has issued more than 2400 decisions on mergers and acquisitions. in 96 % of cases the Autorité cleared the transaction unconditionally.
A leading role in Europe
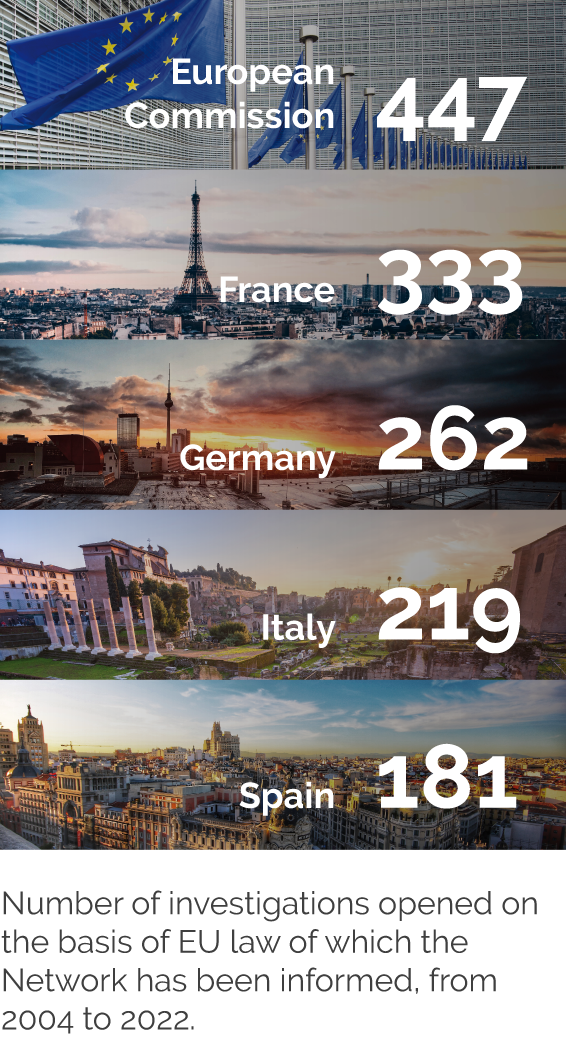
The French authority, the most active national authority
The ECN represents the 28 national competition authorities and the Commission. This encrypted network enables them to share information and communicate on cases under investigation. The aim is to foster convergence and greater effectiveness in the application of competition rules.
Print the page